Quick Facts
- Primary Hotspot: Nice Côte d’Azur (NCE) remains the most turbulent departure point in Europe for 2026.
- Top-Ranked Route: The flight from Nice to Geneva is the most turbulent journey in Europe with an average Eddy Dissipation Rate of 15.367 to 16.065.
- Geographical Factor: Turbulence is primarily caused by mountain waves emanating from the Alps and atmospheric interaction with maritime winds.
- Data Standard: Eddy Dissipation Rate is now the universal metric used by aviation professionals to define atmospheric disturbance intensity.
- Forecasting Window: Modern flight turbulence map tools provide high-accuracy predictions within a 36-hour window, refreshed every 6 hours.
- Peak Intensity: High-altitude jet streams over the French and Swiss borders contribute to frequent Clear Air Turbulence on Alpine routes.
Nice Côte d'Azur (NCE) is 2026's primary turbulence hotspot due to Alpine mountain waves and the complex interaction of Mediterranean maritime winds with rugged terrain. The route between Nice and Geneva remains the most turbulent journey as shown on the latest flight turbulence map, consistently recording the highest atmospheric stress levels for commercial aircraft in Europe.
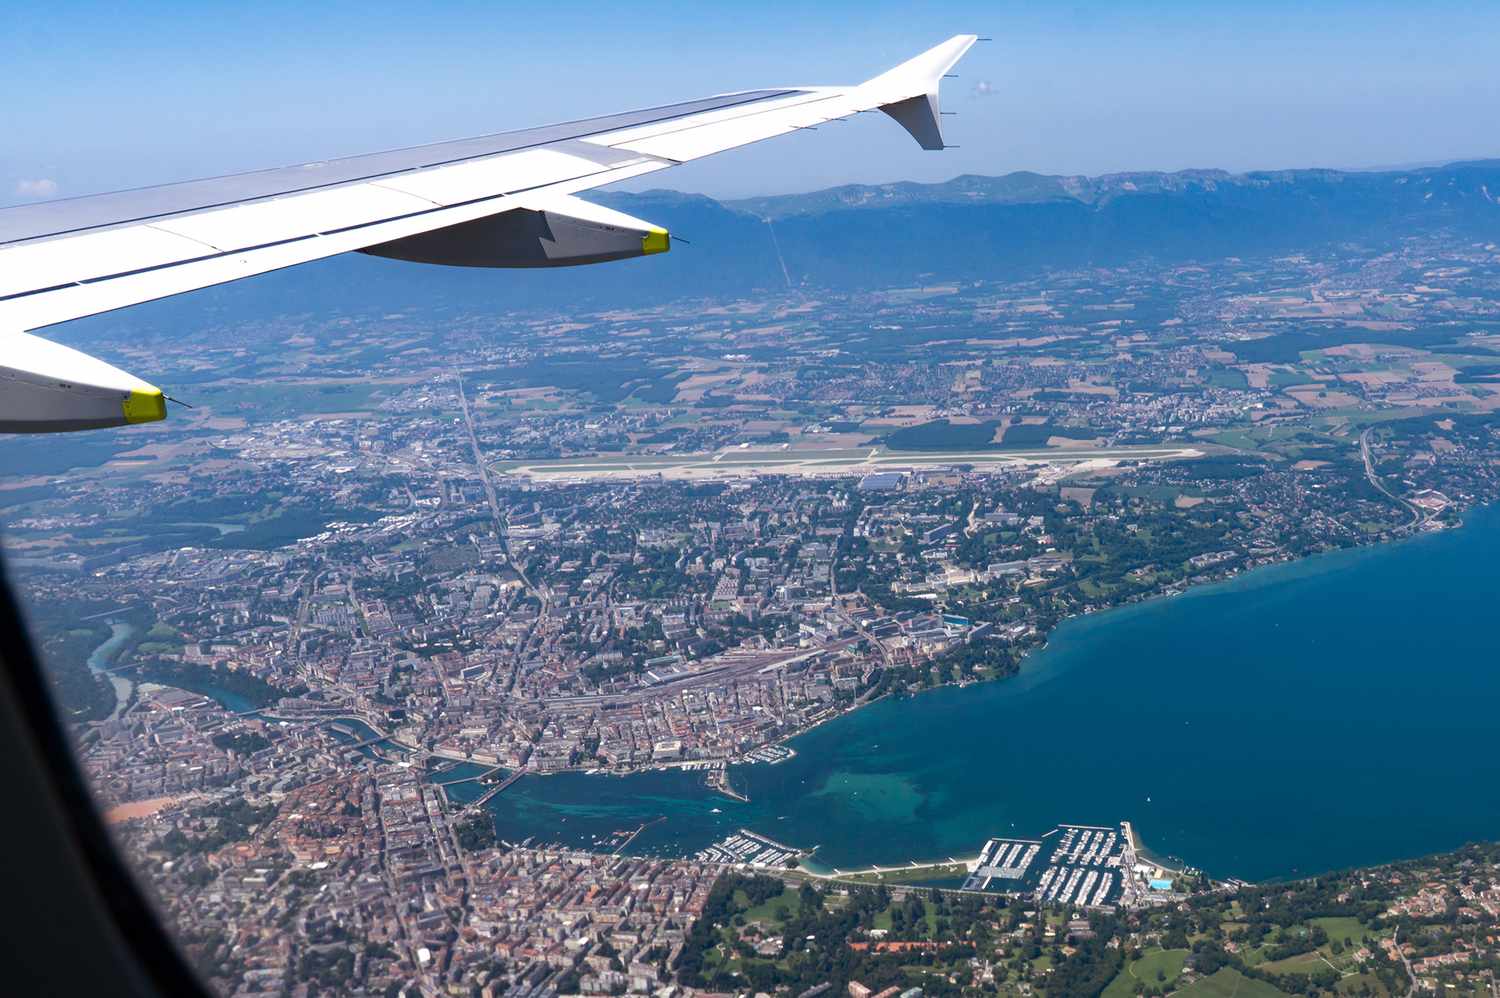
The Nice-Geneva Corridor: Why NCE Dominates the 2026 Flight Turbulence Map
As a travel critic, I often emphasize that not all air corridors are created equal. In 2026, aviation analytics continue to highlight a specific geographic corridor that challenges even the most seasoned frequent fliers. The 299-kilometer flight route from Nice, France, to Geneva, Switzerland, was ranked as the most turbulent in Europe for 2024 and 2025, and the latest 2026 data confirms this trend persists. This short hop records an average Eddy Dissipation Rate (EDR) ranging from 15.367 to 16.065.
While these numbers might seem abstract, they place the Nice-Geneva corridor at the top of the European rankings. For context, while Denver in the United States often reaches an 18.18 EDR due to the Rocky Mountains, the Alpine geography surrounding Nice creates a unique, concentrated area of disturbance that is unmatched on the European continent. In the recent 2025 and 2026 analytics transition, routes originating in Nice occupied the top three spots for the most turbulent European flights, connecting the French Riviera to Geneva, Marseille, and Basel.
The following table illustrates the current IATA code rankings for the most turbulent routes in Europe:
| Rank | Route (From - To) | IATA Codes | Average EDR | Principal Cause |
|---|---|---|---|---|
| 1 | Nice - Geneva | NCE - GVA | 16.065 | Mountain Waves |
| 2 | Nice - Marseille | NCE - MRS | 15.891 | Coastal Interaction |
| 3 | Nice - Basel | NCE - BSL | 15.723 | Alpine Geography |
| 4 | Nice - Zurich | NCE - ZRH | 15.540 | Jet Stream Activity |
| 5 | Milan - Lyon | MXP - LYS | 15.382 | Atmospheric Pressure |
This concentration of high EDR ratings around Nice Côte d’Azur Airport makes it the focal point of any turbulence map europe travelers might consult. Whether you are flying a short regional hop or connecting to a long-haul destination, passing through this airspace requires an understanding of why the air is so restless.
Mountain Waves and Jet Streams: The Science of Alpine Turbulence
To understand why the nice cote d'azur turbulence forecast frequently predicts bumpy rides, we must look at the atmospheric physics of the region. The primary culprit is a phenomenon known as mountain waves. These are mountain waves generated by the proximity to the Alps and the atmospheric interaction between coastal maritime winds and the rugged mountainous terrain.
When stable air flows over a mountain range like the Alps, it creates an oscillation on the leeward side, much like water flowing over a submerged rock in a stream. This creates vertical air currents that can extend deep into the atmosphere. For flights departing Nice, the aircraft must climb or descend through these waves almost immediately. Unlike storm-related turbulence, this Clear Air Turbulence is invisible to the naked eye and often to traditional cockpit radar, making it a "stealth" challenge for pilots.
Aviation meteorology uses Met Office weather models and NOAA data sources to track these movements. The industry has shifted away from subjective pilot reports to a more objective standard: the Eddy Dissipation Rate. EDR measures the rate at which energy is transferred from large-scale atmospheric motions (like the jet streams) to smaller, turbulent scales. This metric is crucial because it accounts for how the aircraft itself reacts to the air.
At typical flight levels, such as the 300 mb pressure altitude (approximately 30,000 feet), the interaction between high-altitude jet streams and the sharp temperature gradients over the Alps further complicates the stability of the air. This combination of Alpine geography and high-velocity wind currents is exactly why a flight turbulence map typically shades the area between Nice and Switzerland in deep oranges or reds.
How to Use a 24 Hour Turbulence Forecast Before Your Flight
For passengers who experience anxiety during flight, data is the best sedative. By consulting a 24 hour turbulence forecast, you can visualize the potential for a bumpy journey well before reaching the boarding gate. Modern platforms integrating a turbulence map world view allow users to see exactly where the patches of disturbed air are located.
When you look at a flight turbulence map, you are essentially seeing a visualization of GTG (Graphical Turbulence Guidance) models. These models are updated every few hours and provide a look-ahead window of up to 36 hours. To get the most out of these tools, it is helpful to follow these steps:
- Check the Refresh Cycle: Most high-quality maps refresh every 3 or 6 hours. Check the timestamp on the map to ensure you are looking at the most recent data.
- Filter by Flight Levels: Turbulence varies wildly by altitude. Ensure the map is set to your aircraft's expected altitude (usually between 30,000 and 40,000 feet for commercial jets).
- Analyze the 24 hour turbulence forecast europe: Look for "blobs" of EDR activity moving across your path. For Nice departures, these often sit stationary over the mountain ridges.
- Identify Clear Air Turbulence: If the map shows turbulence in areas without cloud cover or storms, it is likely Clear Air Turbulence caused by wind shear or jet streams.
For those looking for the best flight times to avoid turbulence in europe, the data suggests that early morning flights (departing before 8:00 AM) often experience smoother air. This is because the thermal heat from the sun has not yet begun to create the rising air currents that exacerbate mountain waves and atmospheric pressure changes. Learning how to read a flight turbulence map effectively replaces the fear of the unknown with the certainty of data.
Safety Protocols: Managing Anxiety During a Bumpy Descent
It is important to maintain perspective when viewing a flight turbulence map. While a high EDR rating indicates a bumpy ride, it does not indicate a dangerous one. Modern aircraft are engineered to withstand forces far greater than those generated by mountain waves or jet streams.
A common metaphor used by flight crews to describe moderate turbulence is the "Diet Coke" test. If the liquid in your glass is splashing against the sides, the EDR is likely in the moderate range. If it leaves the glass entirely, it is considered severe. In 2026, most routes through the Nice-Geneva corridor fall into the light-to-moderate category.
To manage anxiety during these periods, passengers should adhere strictly to seat belt safety protocols. Most injuries related to turbulence occur because passengers are not buckled in during unexpected jolts. Even when the "Fasten Seat Belt" sign is off, keeping your belt loosely fastened while seated is a standard recommendation from the FAA and EASA.
Pilots also rely on Pilot Reports PIREPs from aircraft that have recently flown the same route. If a pilot ahead of you reports significant mountain waves over the Alps, your flight crew may adjust their altitude or speed to mitigate the impact. This constant loop of communication ensures that even when the turbulence map world shows intense activity, the flight remains well within safety margins.
FAQ
How can I check for flight turbulence in real time?
You can use specialized aviation websites or apps that integrate NOAA data sources and GTG models. These tools provide a real-time flight turbulence map where you can enter your flight number or route to see current EDR levels along your path.
Can passengers see turbulence maps before a flight?
Yes, many professional-grade turbulence forecasting platforms are now available to the public. These tools allow passengers to view a 24 hour turbulence forecast for their specific route, providing a visualization of potential bumps based on the latest Met Office weather models.
What do the different colors mean on a turbulence map?
On a standard flight turbulence map, blue and green usually indicate smooth air. Yellow represents light turbulence, orange indicates moderate conditions (where you might see the 'Diet Coke' spill), and red or purple signal severe turbulence that pilots will actively try to avoid by changing flight levels.
How far in advance can you predict turbulence?
While general atmospheric conditions can be predicted days in advance, a precise 24 hour turbulence forecast is the standard for accuracy. Most models offer high reliability within a 36-hour window, as air currents and jet streams can shift rapidly.
Is there an app that shows where turbulence will happen?
Several apps utilize Eddy Dissipation Rate data and Pilot Reports PIREPs to show turbulence locations. These apps allow users to track a flight turbulence map for specific regions like Europe or North America, helping travelers prepare for conditions at different flight levels.